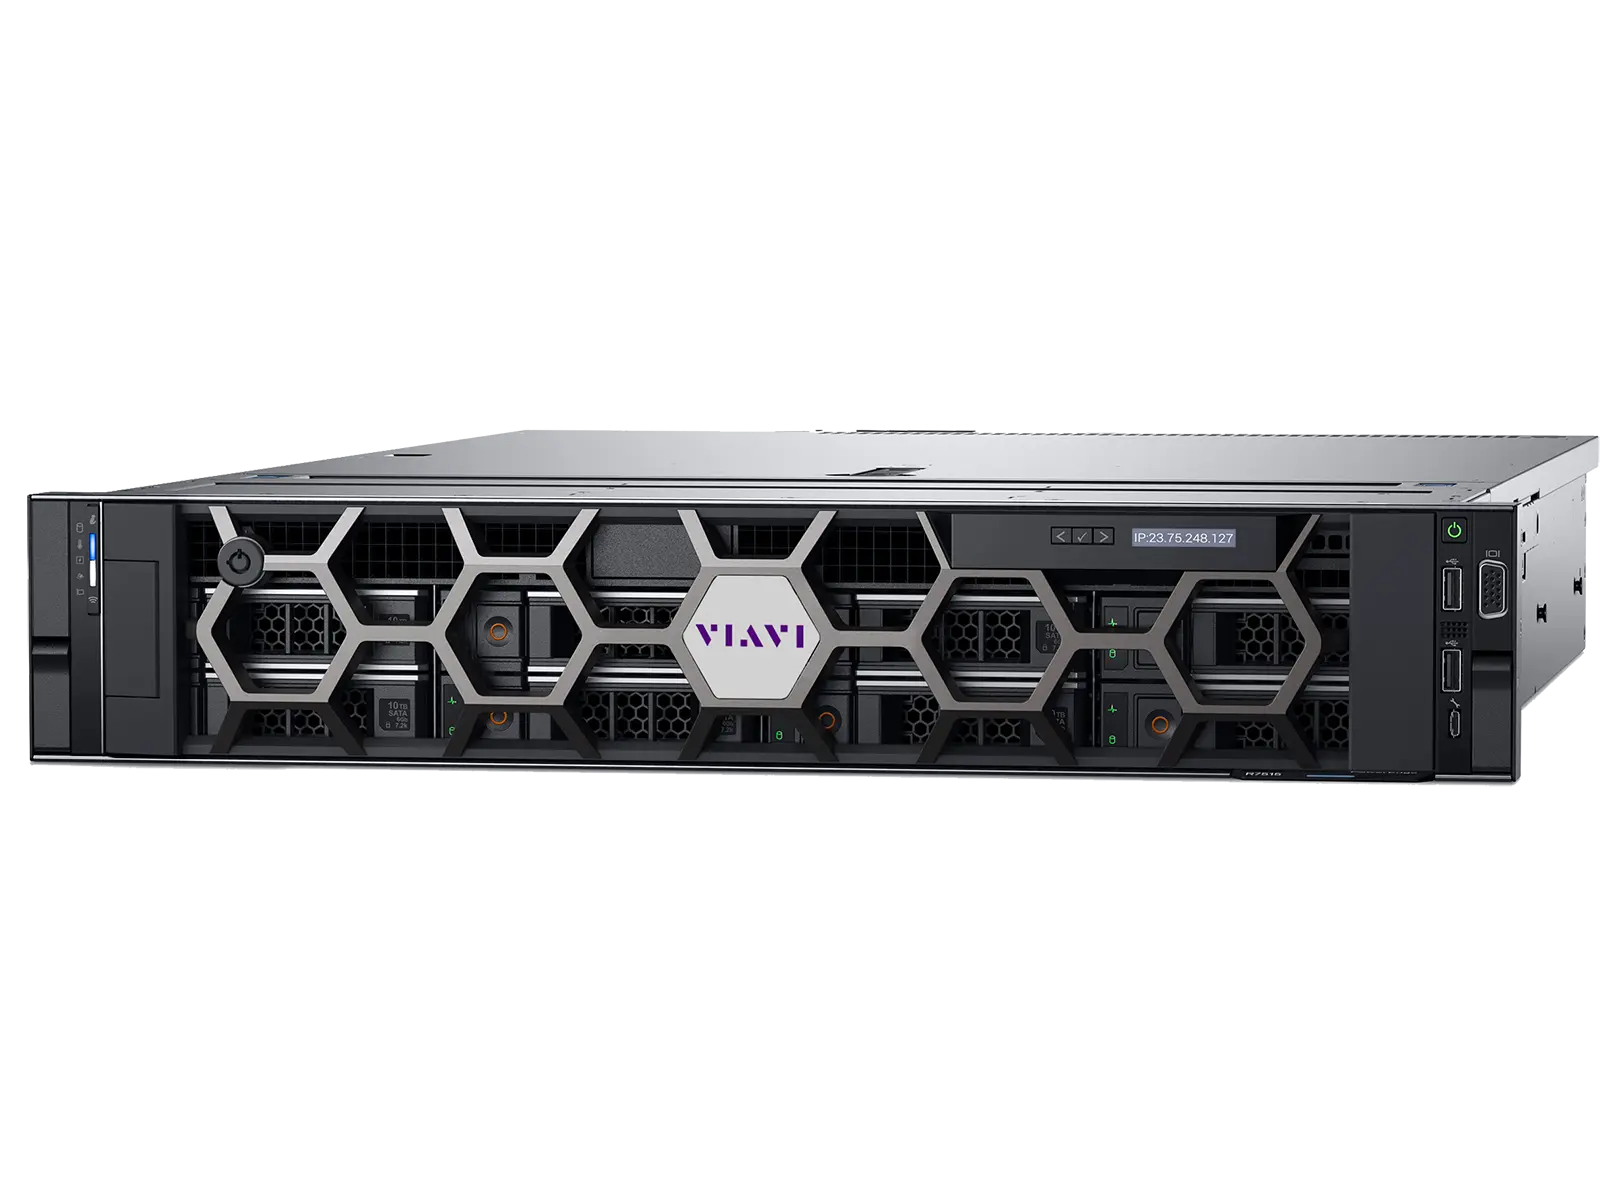
VIAVI XhaulAdvisor XA1000 Real-Time Xhaul Analyzer for Open RAN Fronthaul
Real-time Xhaul analyzer on COTS hardware for Open RAN fronthaul interoperability testing and troubleshooting at 10G, 25G and 100G.
- Weight
- 27.3 kg (60.19 lb)
- Dimensions (w x h x d)
- 434.0 x 86.8 x 647.1 mm (17.09 x 3.42 x 25.48 in)
- Memory
- 8 GB for a single session; Up to 10 sessions
Overview
The VIAVI XhaulAdvisor is a real-time Xhaul analyzer for Open RAN. It is a scalable tool that runs on COTS hardware and is used for interoperability testing and troubleshooting between equipment from different manufacturers. In Open RAN, individual O-RAN components can come from different vendors. Manufacturers need to show that their components work with other vendors' equipment, and operators need to check compliance with specifications, end-to-end interoperability and network performance.
Interoperability issues can occur at several points in the network, so the XhaulAdvisor analyzes fronthaul traffic in real time to find them. It checks optical, signal frequency and Ethernet parameters. It also identifies the C/U-plane, S-plane and M-plane flows and their bandwidth, and analyzes PTP and C/U-plane timing.
Operation modes
The analyzer can be set up in passive mode with an optical tap, or in through mode placed between the DU and RU. Through mode can be non-intrusive or intrusive. In intrusive mode, the instrument can start its own M-plane session to the RU. Analysis runs live or on stored captures, and synchronization comes from the Open Fronthaul or an external timing source.
Integration with other VIAVI tools
The XhaulAdvisor can be used with other VIAVI tools, including TM500 and TeraVM, to troubleshoot errors seen during end-to-end test case execution. It flags and isolates issues caused by Open Fronthaul timing, node configuration, packet content, and RAN, transport or synchronization functions.
Key Features
- Checks optical, signal frequency and Ethernet parameters
- Verifies presence and bandwidth of all C/U-plane, S-plane and M-plane flows
- Analysis of PTP and C/U-plane timing critical to Open Fronthaul performance
- Observes RE/RB channel utilization of C/U-plane flows
- Displays all M-plane sessions
- M-plane client to interact directly with the O-RU M-plane server and verify configuration
- Passive mode or through mode setup (placed between DU and RU)
- Analysis in live mode or post-capture mode
- Synchronization from Open Fronthaul or an external timing source
- Scalable tool running on COTS hardware
- Captures packets at up to 100 Gbps on DL and UL simultaneously
Specifications
| Weight |
27.3 kg (60.19 lb)
Typical at 25°C
|
|---|---|
| Dimensions (w x h x d) |
434.0 x 86.8 x 647.1 mm (17.09 x 3.42 x 25.48 in)
Typical at 25°C
|
| Memory | 8 GB for a single session; Up to 10 sessions |
| Optical Interfaces | 10G, 25G, 100G |
|---|---|
| Transport Stats | Optical power level, Rx Frequency, Ethernet and MAC info |
| Passive mode | Requires optical tap to connect to DL/UL fronthaul signals |
|---|---|
| Non-intrusive through mode | Instrument placed between DU and RU, but not impacting fronthaul signals |
| Intrusive through mode | Instrument placed between DU and RU, while not impacting CUSM plane traffic. It can initiate a secondary M-plane session to RU. |
| Live Mode | Live analysis of Xhaul flows |
|---|---|
| Capture/Replay Mode | Simultaneously captures packets at up to 100 Gbps on DL and UL |
| Flow identification | Identifies all CUSM flows distinguished by MAC/IP address, VLAN, eAxC ID in DL/UL |
|---|
| Profiles | Profiles per Open RAN WG4 IOT |
|---|---|
| Fronthaul Delay T12/T34 | Programmable by user |
| Packet Arrival/Departure | Early/On-time/Late, CU, DL/UL |
| Reference | Reference time from Open Fronthaul or an external source (ToD, 1 PPS, 10 MHz) |
|---|---|
| Analyzer | Displays PTP Master and Slave/Subordinate info including domain number, clockClass, clockAccuracy and message rates |
| Analysis | Displays all M-plane sessions and respective VLAN, MAC/IP addresses |
|---|---|
| Emulation | Establishes an M-plane session with the RU and displays various RU parameters |
| Radio Frames | Displays utilization (%) for each radio frame |
|---|---|
| C-plane stats | Displays C-plane RE utilization for each radio frame in respective PRB/Symbol grid |
| U-plane stats | Displays Power vs. Symbol vs. Carrier for each radio frame in respective PRB/Symbol grid |
Specifications are taken from the manufacturer's documentation. See the datasheet for complete and current values.
Applications
- Open RAN multi-vendor interoperability testing
- Open Fronthaul troubleshooting
- Transport function analysis
- Fronthaul flow exploration
- Fronthaul CU timing analysis
- Fronthaul M-plane analysis
- Fronthaul M-plane emulation
- S-plane PTP analysis
- Fronthaul RE/RB channel utilization analysis
- End-to-end testing with TM500 and TeraVM
Options & Accessories
| Option | Description |
|---|---|
| XA1000 | XhaulAdvisor Mainframe — Includes Capture, Transport and Flow Explorer |
| XA2000 | 10G Ethernet |
| XA2001 | 25G Ethernet |
| XA2002 | 100G Ethernet |
| XA2003 | CU Timing Analysis |
| XA2004 | Channel Utilization |
| XA2005 | S-Plane Analysis |
| XA2006 | S-Plane Stack Emulation (Live Analysis) |
| XA2007 | M-Plane Analysis |
| XA2008 | M-Plane Client |
| ADAP-QSFPSFP28 | QSFP-SFP adaptor to support SFP+/SFP28 application |
| CSFP28-10G-25G-3-1 | SFP28 (10G/25G, 1310 nm) |
| CSFP28-25G-8-1 | SFP28 (25G, 850 nm) |
| CSFPPLUS-1G-10G-3-1 | SFP+ (1G/10G, 1310 nm) |
| CSFPPLUS-1G-10G-8-1 | SFP+ (1G/10G, 850 nm) |
| CQSFP-103G-8-4-SR4 | QSFP28 (100G, SR-4, 850 nm) |
| CQSFP-103G-3-1-FR | QSFP28 (100G, FR, 1310 nm) |
| CSFPPLUS-10G-23-1B | BiDi SFP+ (10G, 1290/1330 nm) |
| CSFPPLUS-10G-32-1B | BiDi SFP+ (10G, 1330/1290 nm) |
| CSFP28-25G-23-1B | BiDi SFP28 (10G/25G, 1290/1330 nm) |
| CSFP28-25G-32-1B | BiDi SFP28 (10G/25G, 1330/1290 nm) |
Documents & Resources
Related Products

Virtualized endpoint emulation platform for validating VPN, ZTNA, SASE, firewall and application security performance at scale.
Network tester that emulates thousands of mobile devices to test 4G, 5G and Open RAN base stations across the full protocol stack.