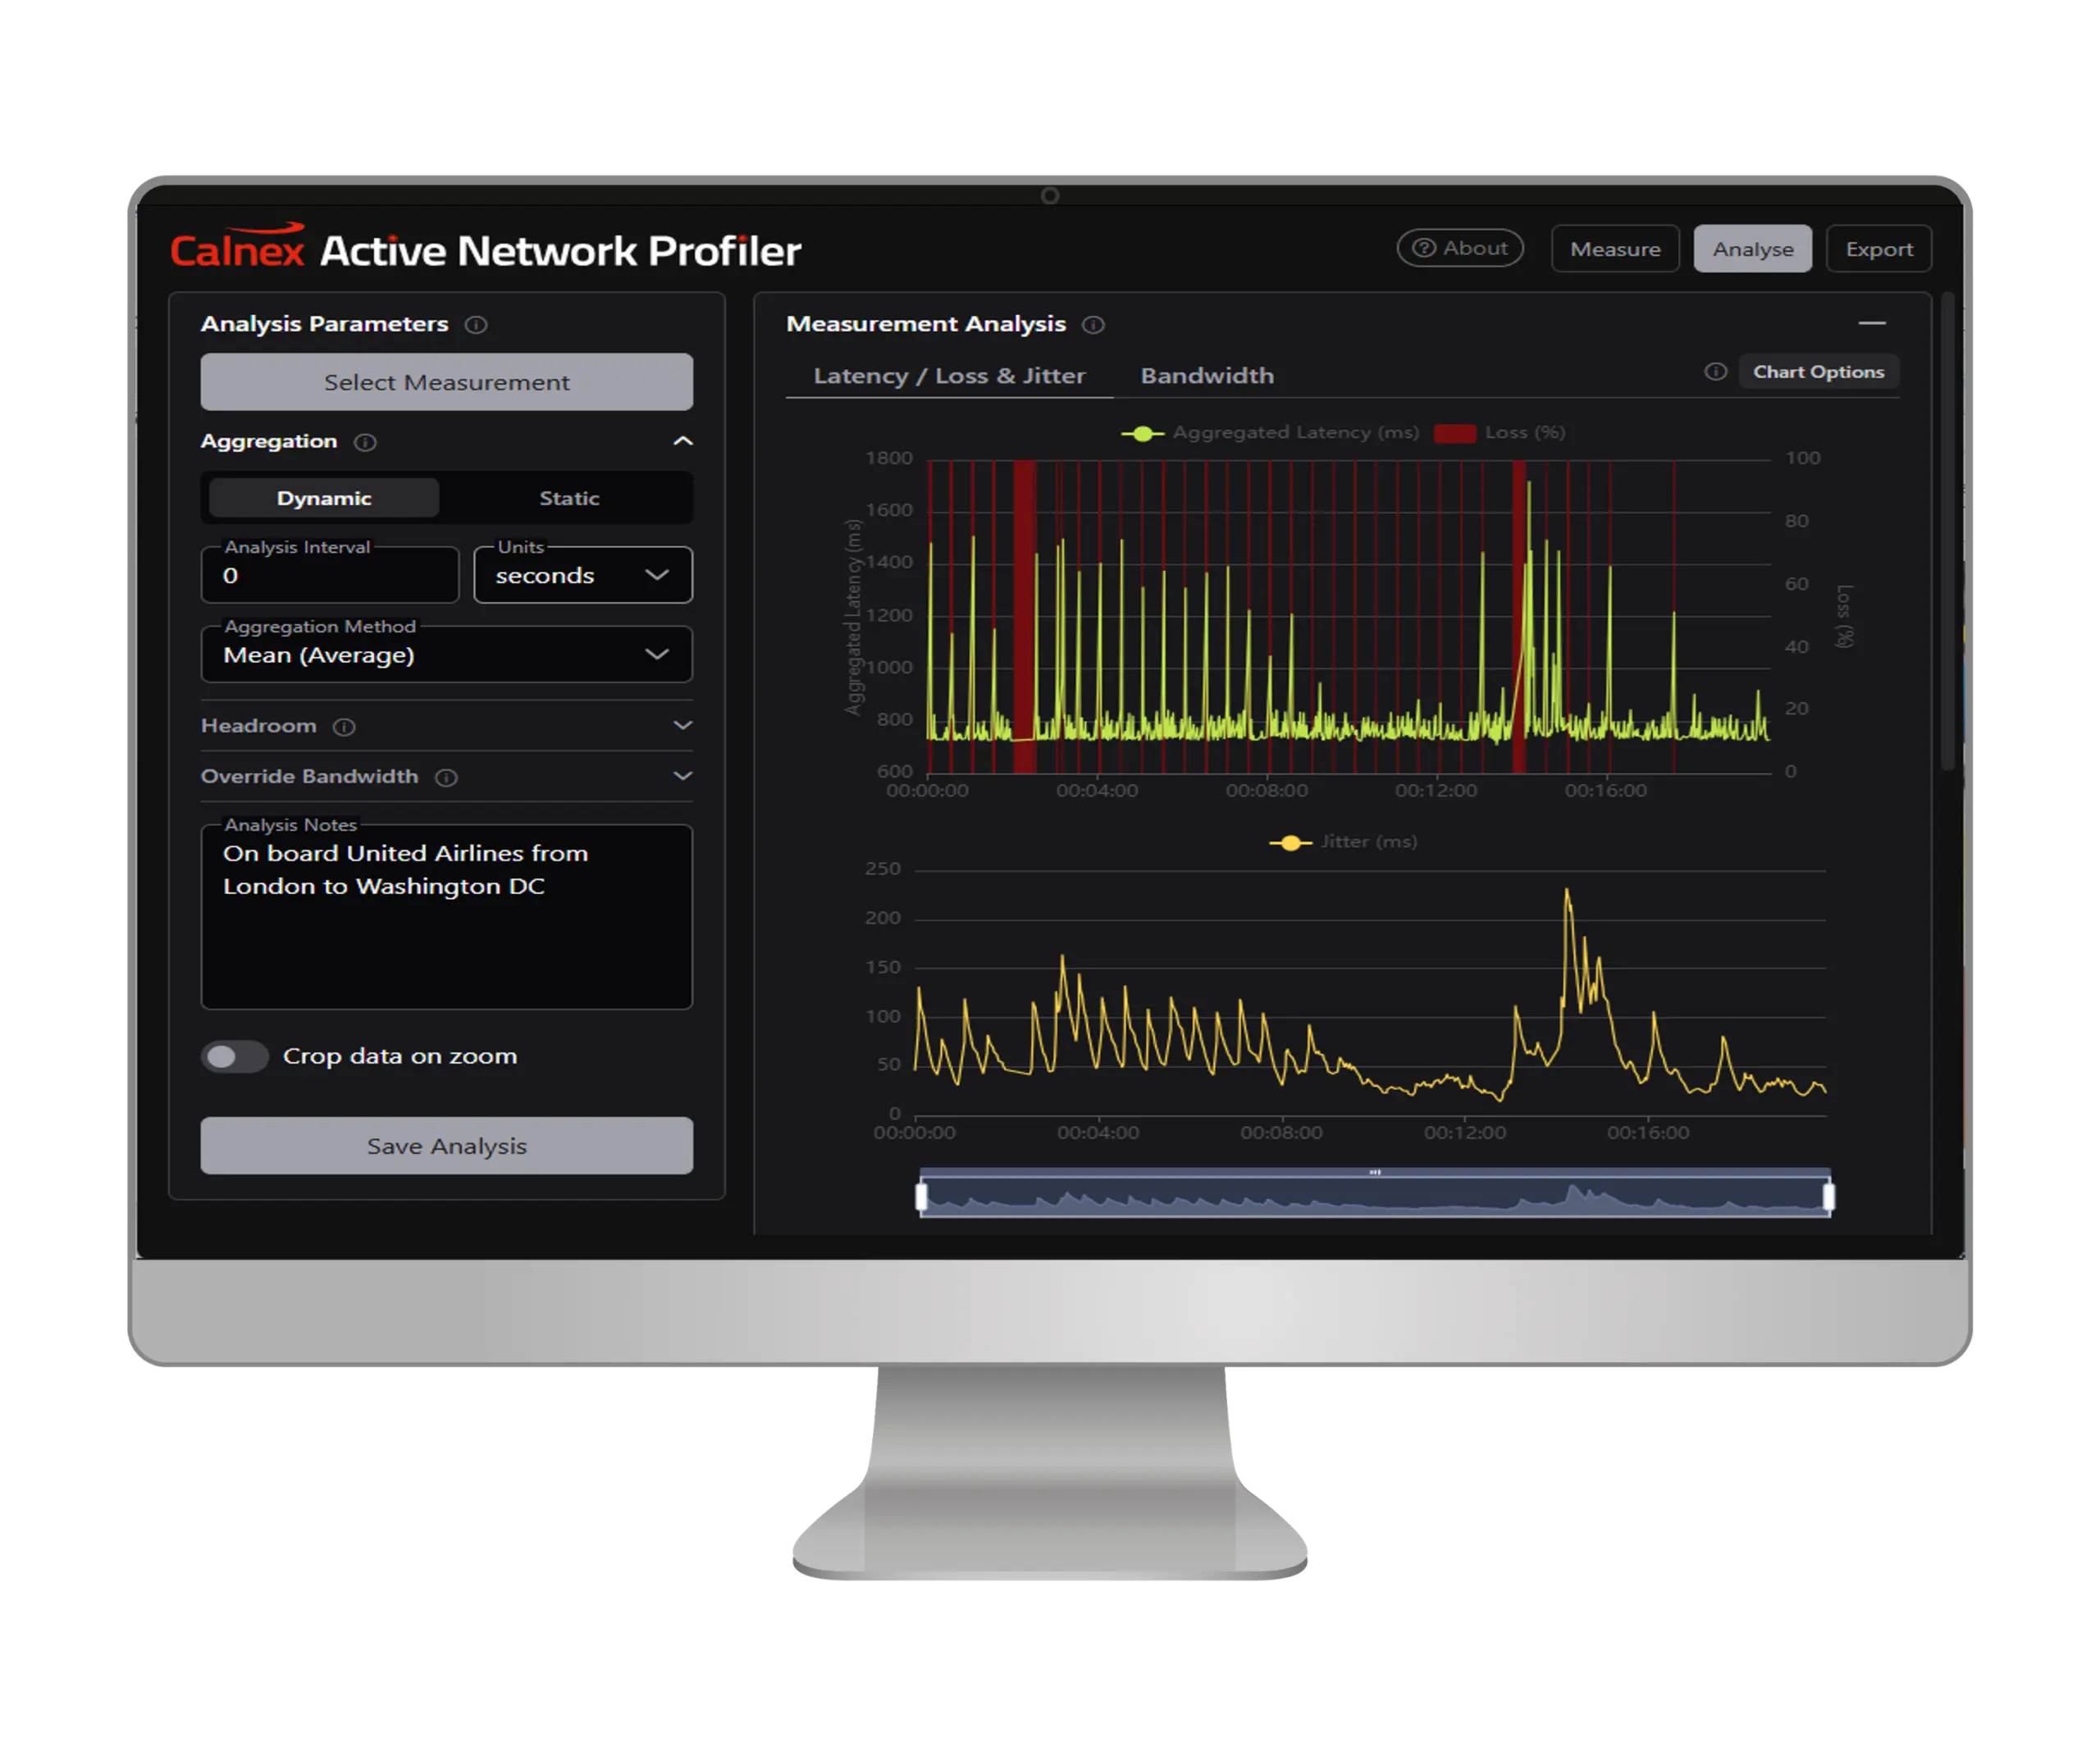
Calnex Active Network Profiler Network Measurement and Emulation Profiling Software
Windows software that actively probes any network for latency, jitter, loss and bandwidth and exports emulation profiles to the NE-ONE Enterprise.
- Measured parameters
- Latency (RTT), packet loss, jitter and available bandwidth
- Target
- Target IP address or URL
- Configurable parameters
- Probe intervals, probe durations and sample frequencies, set independently for latency/loss and bandwidth
Overview
The Calnex Active Network Profiler is Windows software that actively probes a target network, such as a cloud service, satellite link, mobile connection, Wi-Fi or enterprise WAN, and captures its performance characteristics in real time. The user enters a target IP address or URL, sets a measurement duration and starts the test. Latency (RTT), packet loss, jitter and available bandwidth are tracked simultaneously and update live while the test runs. No additional hardware and no network privileges beyond a standard connection are required.
Measurement
Probe intervals, probe durations and sample frequencies can be set independently for latency/loss and for bandwidth. Available bandwidth is measured with minimal probe traffic, so the profiler can run on production and customer networks without disrupting live traffic. Every measurement is stored with its configuration, timestamps and free-text notes, for example location, environmental conditions or test scenario, so it can be revisited and re-analyzed later.
Analysis
The built-in Analyze module turns raw probe data into network profiles for emulation. Dynamic aggregation groups data into rolling time intervals to preserve variation over time, while Static aggregation derives a single representative value across the full dataset. Mean, Median or Inter-Percentile Mean methods control how spikes and outliers are handled, and jitter (PDV) is calculated automatically from the latency data. Headroom controls add a percentage safety margin to latency, loss and bandwidth so the emulated network is not better than the measured one. Crop Data on Zoom isolates a specific timeframe, such as a satellite handover or a congestion window, and saves only that portion as the analysis profile.
Export to NE-ONE Enterprise
A single export generates an encrypted link profile file that imports directly into the Calnex NE-ONE Enterprise emulator without manual setup. Saved link profiles are kept in a library showing name, date, duration and a statistical summary, so teams can build and share a set of real-world network conditions for regression testing, acceptance testing and demonstrations.
Key Features
- Actively probes any network to capture available bandwidth, latency, jitter and loss
- Latency (RTT), packet loss, jitter and available bandwidth tracked simultaneously with live updating graphs
- Independently configurable probe intervals, probe durations and sample frequencies for latency/loss and bandwidth
- Free-text notes stored alongside measurement data
- Measurements stored with configuration, timestamps and notes for later re-analysis
- Dynamic and Static aggregation modes
- Mean, Median and Inter-Percentile Mean aggregation methods
- Jitter (PDV) calculated automatically from latency data
- Headroom controls add a safety margin to latency, loss and bandwidth
- Crop Data on Zoom to analyze a selected time window
- Non-intrusive bandwidth measurement with minimal probe traffic
- Encrypted link profile export with one-click import into the Calnex NE-ONE Enterprise
- Link profile library with name, date, duration and statistical summary
- Integration with automated test systems via APIs and orchestration frameworks
- Windows-native software, no additional hardware required
Specifications
| Measured parameters |
Latency (RTT), packet loss, jitter and available bandwidth
Tracked simultaneously, updating live
|
|---|---|
| Target | Target IP address or URL |
| Configurable parameters | Probe intervals, probe durations and sample frequencies, set independently for latency/loss and bandwidth |
| Aggregation modes | Dynamic, Static |
|---|---|
| Aggregation methods | Mean, Median, Inter-Percentile Mean |
| Jitter | Jitter (PDV) calculated automatically from the latency data |
| Headroom |
Safety margin on latency, loss and bandwidth
Applied as a percentage before export
|
| Operating system |
Windows 10 64-bit version 21H2 or above / Windows 11
Minimum and recommended
|
|---|---|
| Processor (minimum) |
Dual Core Intel/ AMD at 2.8 Hz
As printed in the datasheet; the unit is likely intended as GHz
|
| Processor (recommended) | 4 Core Intel / AMD Ryzen Series 3 |
| Memory (minimum) | 4 GB |
| Memory (recommended) | 8 GB |
| Storage (minimum) |
5 GB
Core software
|
| Storage (recommended) |
10 GB
Extra space for data
|
| Internet connection | Not required for installation. May be required for measurements. |
Specifications are taken from the manufacturer's documentation. See the datasheet for complete and current values.
Applications
- LEO satellite and aerospace links
- Mobile and 5G networks
- Cloud and enterprise WAN
- IoT and connected devices
- Wi-Fi and home broadband
- Non-terrestrial networks (NTN)
- Network emulation profile creation
- Application readiness testing
- Regression and acceptance testing
- Root cause analysis of field scenarios